Percent Rank
Math · Rolling
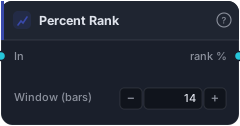
Percent (0–100) of the prior N bars that are below the current value — where the current value ranks in its own recent history. Regime / relative-strength scoring ('ATR in the top quartile of the last 100 bars'). NaN for the first N bars.
Percent Rank tells you where the current value sits within its own recent history, as a 0–100 percentile. A reading of 90 means the current value is higher than 90% of the last N bars; a reading of 10 means it's near the bottom of its range. It turns any series into a self-normalising "how extreme is this, for this series" score.
How it works
Each bar the block looks at the prior window values and returns the percentage of them that are below the current value. Because it's a rank rather than an absolute reading, it automatically adapts to whatever scale the input lives on — no thresholds to hand-tune per instrument. The first window bars are NaN while the history builds. Lookahead-free.
When to use it
Use it for regime and relative-strength scoring: "is ATR in the top quartile of the last 100 bars?" (volatility regime), "is this the strongest momentum reading in a while?", or to compare stretch across different series on a common 0–100 footing. It's the honest way to ask "extreme relative to normal" without baking in a magic price level.
Example
Volatility-regime gate: wire an ATR into Percent Rank (window = 100), then require it to be above 75 with GreaterThan before taking breakout entries — so you only trade breakouts when volatility is genuinely elevated for this market.
Tips & gotchas
- Self-normalising — the same thresholds (e.g. 80/20) work across instruments and timeframes.
- Percentile of the window, not all-time — a bigger window is a longer memory of "normal."
- First
windowbars are NaN. - It ranks magnitude, not direction — pair with a trend read if you need both.
Related blocks
Inputs
| Socket | Type | What to wire in |
|---|---|---|
| In | series / bars |
Source series. BARS input uses close. |
Outputs
| Output | Type | Plots as | Description |
|---|---|---|---|
| rank % | series |
Line · sub-pane | Percent of the trailing N bars below the current value. |
Parameters
| Parameter | Type | Default | What it does |
|---|---|---|---|
| Window (bars) | number · 2–500 | 14 |
Bars in the rolling window. |
Reference auto-generated from the block catalog · category Math.