Kalman Filter
Indicators · Moving Averages
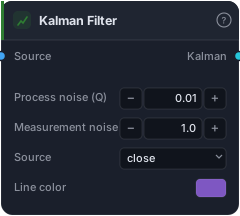
Scalar Kalman filter price smoother — adaptive gain from process/measurement noise.
The Kalman Filter treats the "true" price as a hidden value buried under noisy ticks, and estimates it bar by bar. The result is a smooth line that tracks price with strikingly little lag for how clean it looks — the classic engineer's answer to "give me the signal without the jitter." It's a smoother, not an oscillator: one line on the price pane that you tune from razor-sharp to glassy-smooth with a single feel.
How it works
This is the scalar (1-D) Kalman filter. It models price as a random walk observed through measurement noise, and each bar runs the standard predict-then-update recursion:
P = P + Q                  # uncertainty grows
K = P / (P + R)            # Kalman gain
x = x + K·(price − x)      # nudge the estimate toward the new price
P = (1 − K)·P              # uncertainty shrinks
Only the ratio of the two knobs matters. Process noise (Q) (default 0.01) is how much you believe the true price really moved — higher Q makes the filter trust new prices and track tightly. Measurement noise (R) (default 1.0) is how much you distrust each individual print — higher R makes it smoother and laggier. The gain K adapts through the opening bars and then settles to a constant, at which point the filter behaves like an EMA whose alpha you dialled in through Q and R. Source defaults to close; the estimate plots on the price pane in your Line color, seeded from the first bar (no warm-up gap).
When to use it
Use the Kalman Filter anywhere you'd use a smoothing MA but want less lag for the same smoothness — a clean trend/bias line, a de-noised input to feed into slope or crossover logic, or a visually tidy guide on noisy, gappy instruments. Because it's a low-lag low-pass filter (in the same family as the Two-Pole Super Smoother), it's especially nice when a plain EMA looks too ragged but a longer EMA lags too much.
Example
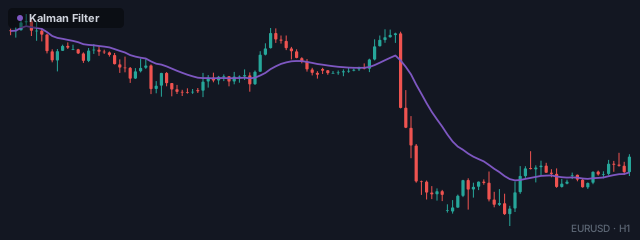
Wire bars into the Kalman Filter as a smooth bias line: go long only while price holds above the estimate and the estimate is rising. Feed price and the Kalman line into a Crosses Above → Tester → Tester. Start with the defaults, then raise R (or lower Q) until the line is as smooth as you want without falling behind real turns.
Tips & gotchas
- It's the Q/R ratio that matters, not the absolute numbers — doubling both leaves the filter unchanged.
- Higher R (or lower Q) = smoother and laggier; lower R (or higher Q) = tighter and twitchier. Tune by feel against the chart.
- At steady state it's essentially an EMA — the magic is the adaptive opening transient and the intuitive two-knob feel, not a different long-run shape.
- This is the price-smoother Kalman, not a full state-space trend/velocity model — it estimates level, not slope. Read its direction from its own slope.
Related blocks
Inputs
| Socket | Type | What to wire in |
|---|---|---|
| Source | bars / series |
Price bars or any indicator series |
Outputs
| Output | Type | Plots as | Description |
|---|---|---|---|
| Kalman | series |
Line | Kalman-filtered price estimate |
Parameters
| Parameter | Type | Default | What it does |
|---|---|---|---|
| Process noise (Q) | number · 0.0001–10.0 | 0.01 |
Higher Q → tracks price faster (less smoothing) |
| Measurement noise (R) | number · 0.0001–100.0 | 1.0 |
Higher R → smoother / laggier (trusts price less) |
| Source | choice (close, open, high, low, hl2, hlc3, ohlc4) |
close |
|
| Line color | colour | #7e57c2 |
Reference auto-generated from the block catalog · category Indicators.