Laguerre RSI
Indicators · Oscillators
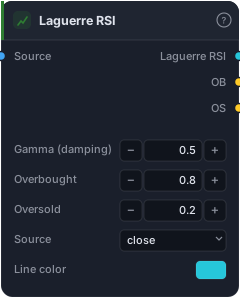
Ehlers's Laguerre RSI — fast, smooth bounded oscillator (0..1).
Laguerre RSI is John Ehlers's reworking of the RSI into something far smoother and faster to respond. It lives in a tidy 0–1 band like a normalised RSI, but instead of a fixed lookback it runs price through a short Laguerre filter first, so it snaps to overbought/oversold with very little lag and almost none of the ragged false flips a short-period RSI throws off. You get the line plus ready-made overbought and oversold boolean outputs.
How it works
Price (your Source, default close) is passed through a four-stage Laguerre filter — L0, L1, L2, L3 — whose memory is controlled by a single Gamma (damping) factor (default 0.5). Low gamma is fast and responsive; high gamma is slow and glassy. The four stages are then fed into an RSI-style cumulative up/down ratio:
CU/CD = sums of the up/down differences across L0 > L1 > L2 > L3
Laguerre RSI = CU / (CU + CD)        # bounded 0..1
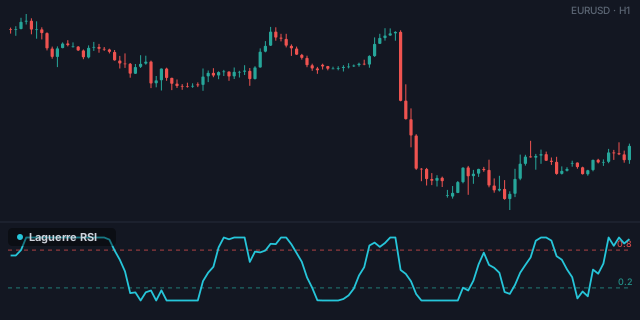
The result sits in a sub-pane, scaled 0–1. The OB output fires when it pushes above Overbought (default 0.8) and OS below Oversold (default 0.2); those two levels are drawn as dashed guides. Because the filter seeds from zero, the line is defined from the first bar.
When to use it
Use it like RSI — fade extremes in ranges, time pullbacks in trends — but where a normal RSI is too laggy or too jittery. The Laguerre smoothing lets you run a responsive overbought/oversold signal without dropping to a noisy 5- or 7-period RSI. It's well suited to faster timeframes and to mean-reversion entries that need to fire promptly when momentum exhausts. The usual oscillator caution applies: in a powerful trend the line can pin near 0.8/0.2, so confirm with a regime filter before fading.
Example
A crisp pullback long: wire bars into Laguerre RSI, take the OS output and require the line to turn back up out of oversold via a Crosses Above, into a Tester. Gate it to an uptrend with a higher-timeframe EMA or ADX / DMI, and backtest in the Tester. Nudge Gamma up if you want fewer, calmer signals.
Tips & gotchas
- Gamma is the only speed knob — lower = faster and twitchier, higher = smoother and slower. Most traders sit around 0.5–0.7.
- It's 0–1, not 0–100 — set thresholds accordingly (0.8/0.2 are the conventional extremes).
- Far less whipsaw than a short-period RSI at comparable responsiveness — that's the reason to choose it.
- Overbought still isn't "sell." In a strong trend it can hug the top band; filter the regime before fading.
Related blocks
Inputs
| Socket | Type | What to wire in |
|---|---|---|
| Source | bars / series |
Price bars or any indicator series |
Outputs
| Output | Type | Plots as | Description |
|---|---|---|---|
| Laguerre RSI | series |
Line · sub-pane | Laguerre RSI (0..1) |
| OB | signal |
— | Above the overbought level |
| OS | signal |
— | Below the oversold level |
Parameters
| Parameter | Type | Default | What it does |
|---|---|---|---|
| Gamma (damping) | number · 0.0–0.99 | 0.5 |
|
| Overbought | number · 0.5–1.0 | 0.8 |
|
| Oversold | number · 0.0–0.5 | 0.2 |
|
| Source | choice (close, open, high, low, hl2, hlc3, ohlc4) |
close |
|
| Line color | colour | #26c6da |
Chart guides
This indicator draws reference level(s): overbought, oversold.
Reference auto-generated from the block catalog · category Indicators.