Hurst Exponent
Indicators · Statistics
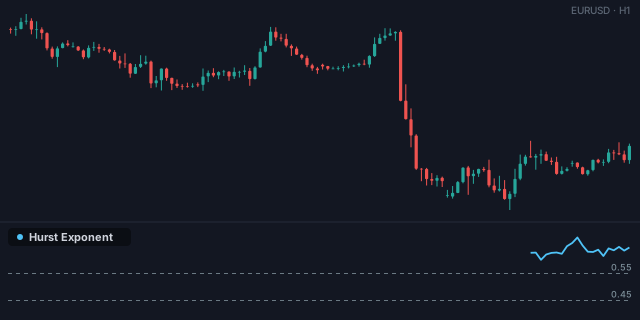
Rolling Hurst exponent (R/S) — trending (>0.5) vs mean-reverting (<0.5) regime.
The Hurst Exponent is a regime gauge: it tells you whether a market is currently trending (moves tend to persist), mean-reverting (moves tend to snap back), or behaving like a random walk. It boils that question down to a single number around 0.5 — above means momentum, below means fade, right at it means no edge from either. It's less a trade trigger than a strategy switch: it tells you which kind of system should be running right now.
How it works
The block runs classic rescaled-range (R/S) analysis over a rolling Window (default 100) — and, importantly, on the bar-to-bar returns, not raw price. (Run on price levels you'd get H ≈ 1 every time, because prices are integrated; on returns you get the real regime signal.) Within the window it splits the data into progressively smaller chunks, measures how the rescaled range R/S grows with chunk size, and takes the slope of log(R/S) vs log(size) — that slope is H:
- H > 0.5 — persistent / trending: up-moves tend to follow up-moves.
- H ≈ 0.5 — random walk: no memory, no statistical edge.
- H < 0.5 — anti-persistent / mean-reverting: moves tend to reverse.
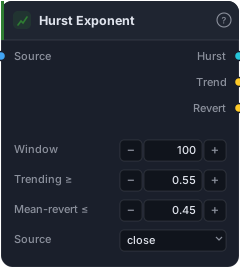
A dashed guide marks 0.5; the Trend signal fires above Trending ≥ (default 0.55) and Revert fires below Mean-revert ≤ (default 0.45), with that neutral band in between. It needs a full window of history, so the first Window bars are blank (NaN warm-up). Source defaults to close.
When to use it
Use Hurst as the top-level regime filter for an adaptive strategy: only let your momentum/breakout logic fire while Trend is true, and only let your mean-reversion/fade logic fire while Revert is true. That single gate stops the most common failure mode — running a trend system in a choppy range, or fading a market that's actually trending. It pairs well with Choppiness, R-Squared and Volatility Regime, which measure related but distinct facets of "what kind of market is this."
Example
A regime-switched book: compute Hurst on bars, then gate two sub-strategies — route your breakout entries through an And/condition with Trend, and your mean-reversion entries through one with Revert — into a Tester. Now each engine only trades in the regime it's built for. Widen the neutral band (raise Trending ≥, lower Mean-revert ≤) to be more selective about declaring a regime.
Tips & gotchas
- It's a regime label, not an entry — it tells you which system to run, not when to click buy.
- Computed on returns, by design — that's why it centres on 0.5; an H built on raw price would read ≈1 always and tell you nothing.
- Needs a full window before it prints anything, and it's heavier to compute than a simple MA — use a sensible Window (100 is a good default).
- Estimates wander on short windows. Treat it as a slow-moving backdrop, not a bar-to-bar trigger; the neutral band exists to avoid flip-flopping around 0.5.
- Several Hurst estimators exist — this is the standard R/S method; don't expect it to match a different library's variant to the decimal.
Related blocks
Inputs
| Socket | Type | What to wire in |
|---|---|---|
| Source | bars / series |
Price bars or any indicator series |
Outputs
| Output | Type | Plots as | Description |
|---|---|---|---|
| Hurst | series |
Line · sub-pane | Hurst exponent (≈0.5 random, >0.5 trend, <0.5 mean-revert) |
| Trend | signal |
— | Hurst above the trending threshold |
| Revert | signal |
— | Hurst below the mean-reverting threshold |
Parameters
| Parameter | Type | Default | What it does |
|---|---|---|---|
| Window | number · 16–500 | 100 |
|
| Trending ≥ | number · 0.5–1.0 | 0.55 |
|
| Mean-revert ≤ | number · 0.0–0.5 | 0.45 |
|
| Source | choice (close, open, high, low, hl2, hlc3, ohlc4) |
close |
Chart guides
This indicator draws reference level(s): trending_above, reverting_below.
Reference auto-generated from the block catalog · category Indicators.