R-Squared (Trend Strength)
Indicators · Statistics
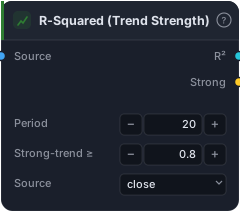
Rolling R² of a linear fit — how straight (trending) vs choppy the move is.
R-Squared measures how straight a move is. It fits a straight line through the recent price and reports the fraction of the action that line explains, from 0 to 1: near 1 means price is marching in an almost perfectly linear trend, near 0 means it's wandering with no linear direction at all. It says nothing about which way — only how trend-like versus choppy the market is right now. It's a clean, statistically honest regime gauge.
How it works
Over the Period (default 20) the block runs a least-squares regression of the Source against bar index and outputs the coefficient of determination, R² — the square of the correlation between price and a straight line:
Because it's squared, it's always 0–1 and direction-agnostic (a clean downtrend scores just as high as a clean uptrend). It plots in a sub-pane with a dashed guide at the Strong-trend ≥ threshold (default 0.8); the Strong signal fires when R² is above it. It needs a full window, so the first Period − 1 bars are blank. For direction, pair it with the slope from Linear Regression.
When to use it
Use R² as a trend-quality filter. A breakout or trend-following entry is far more reliable when R² is high (the move is genuinely linear) than when it's low (price is sawing sideways and any "breakout" is likely noise). Conversely, mean-reversion setups prefer low R² — a market with no linear trend is one that keeps returning to its mean. It's the statistical cousin of ADX / DMI and Choppiness: all three answer "is there a trend?", and stacking two of them makes a robust regime gate.
Example
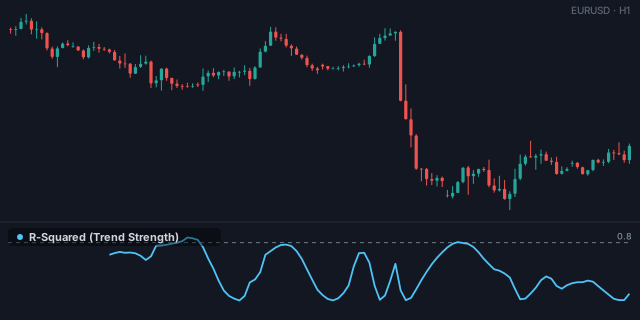
Gate breakouts to clean trends: compute R² on bars, and require Strong to be true before any breakout entry is allowed to fire — wire it through an And with your breakout condition into the Tester. Add the Linear Regression slope sign to decide long versus short. Raise Strong-trend ≥ toward 0.9 to demand even cleaner trends.
Tips & gotchas
- Strength only, not direction — a 0.9 reading just says "very linear"; read the sign from a regression slope or a moving average.
- High R² favours trend/breakout logic; low R² favours mean-reversion — it's a switch between styles.
- Period sets the horizon — a short period measures the straightness of the last few bars; a long one judges the broader leg.
- Pairs powerfully with a trend-direction tool — R² for quality, slope or MA for which way.
Related blocks
Inputs
| Socket | Type | What to wire in |
|---|---|---|
| Source | bars / series |
Price bars or any indicator series |
Outputs
| Output | Type | Plots as | Description |
|---|---|---|---|
| R² | series |
Line · sub-pane | Coefficient of determination (0..1) |
| Strong | signal |
— | R² above the strong-trend threshold |
Parameters
| Parameter | Type | Default | What it does |
|---|---|---|---|
| Period | number · 3–400 | 20 |
|
| Strong-trend ≥ | number · 0.0–1.0 | 0.8 |
|
| Source | choice (close, open, high, low, hl2, hlc3, ohlc4) |
close |
Chart guides
This indicator draws reference level(s): threshold.
Reference auto-generated from the block catalog · category Indicators.