Ulcer Index
Indicators · Volatility
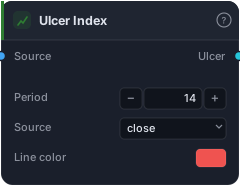
Ulcer Index — downside (drawdown-depth) volatility; low = shallow pullbacks.
The Ulcer Index measures the kind of volatility that actually hurts: drawdowns. Standard-deviation volatility punishes upside and downside equally, but a trader doesn't lose sleep over a rally — they lose it over how deep and how long price sits underwater. Peter Martin's Ulcer Index captures exactly that "how much pain" feeling in a single line. Low means shallow, quick pullbacks; high means deep or prolonged drops from recent highs.
How it works
Over the Period (default 14) the block tracks how far the Source (default close) is below its highest point in the window, as a percentage, then takes the root-mean-square of those drawdowns:
Drawdown = 100 · (close − highest close in window) / highest close   # ≤ 0
Ulcer    = sqrt( average of Drawdown²  over the window )
Squaring before averaging is the key trick: it weights deep drawdowns much more heavily than shallow ones, so a single nasty plunge moves the index far more than a series of small dips — which matches how risk actually feels. The line sits at 0 whenever price is making new highs and rises as it falls away from them. It plots in a sub-pane in your Line color, defined from the first bar (no warm-up gap).
When to use it
Use the Ulcer Index as a downside-risk meter. As a filter, a rising Ulcer Index warns that drawdowns are deepening — a cue to cut size, tighten stops, or stand aside even if a price trigger still looks fine. As a comparison tool it's excellent for ranking strategies or assets on pain rather than raw volatility (the "Ulcer Performance Index" divides return by Ulcer for exactly this). It complements symmetric volatility tools like Standard Deviation, ATR and Historical Volatility, which don't distinguish up-moves from down-moves.
Example
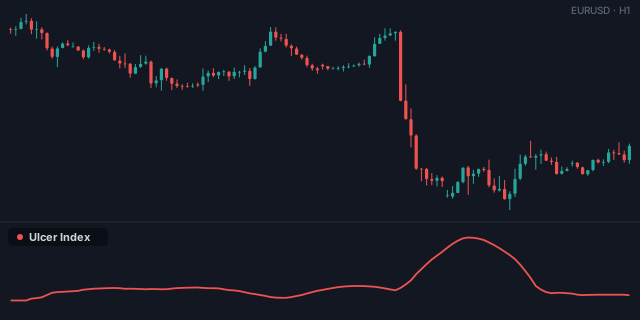
A risk-aware gate: compute the Ulcer Index on bars and only allow new long entries while it sits below a tolerance you set (wire it through a Less Than against a Constant, then And it with your entry condition into the Tester). When drawdowns deepen and the index climbs, fresh longs are blocked until calm returns. Compare its shape against ATR to see how it ignores upside volatility entirely.
Tips & gotchas
- Downside only. A sharp rally leaves the Ulcer Index near 0 — that's the feature, not a bug.
- Deep drawdowns dominate thanks to the squaring; one big plunge outweighs many small dips.
- Reads 0 at new highs and grows as price falls away — a quiet, rising line is an early "things are getting uncomfortable" warning.
- Great for comparing pain across strategies/assets — pair it with returns for a risk-adjusted ranking.
- Period sets the memory — shorter reacts faster to fresh drawdowns; longer captures prolonged underwater stretches.
Related blocks
Inputs
| Socket | Type | What to wire in |
|---|---|---|
| Source | bars / series |
Price bars or any indicator series |
Outputs
| Output | Type | Plots as | Description |
|---|---|---|---|
| Ulcer | series |
Line · sub-pane | Ulcer Index (downside volatility) |
Parameters
| Parameter | Type | Default | What it does |
|---|---|---|---|
| Period | number · 2–400 | 14 |
|
| Source | choice (close, open, high, low, hl2, hlc3, ohlc4) |
close |
|
| Line color | colour | #ef5350 |
Reference auto-generated from the block catalog · category Indicators.